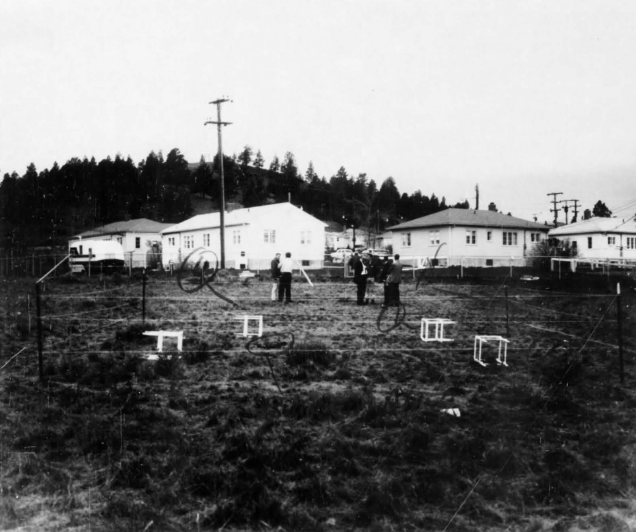
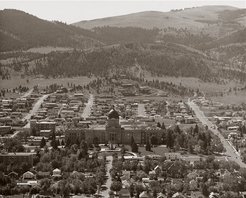
 Capitol Area in 1965
In the Rocky Mountain States it rose 41%. Montana, however, only saw an increase of 14%.
In that same time period, per capita income in America rose 60% but in Montana it only went up 26%.
In 1950 Montana’s per capita income had been 8% above the national average but by 1968 it was 16% below. In 1950 Montana earned 0.42% of the nation’s income but by 1968 this had fallen 0.30%.
What happened?
The main reasons for this decline were threefold:
- Declines in real income per worker in agriculture;
- Stagnant nonagricultural incomes that didn’t keep pace with national increases;
- An overall decline in the number of people working, leading to a greater need for support of those people from the available employment pool…which sometimes necessitates taking workers out of that employment pool to provide full-time, nonpaid support.
Oftentimes that Social Security or insurance check each month wasn’t just going to a senior, but the family or community member caring for them as well.
This has also resulted in “an increasingly rapid out-migration of educated young people who despair of finding rewarding employment opportunities here.”
Non-agricultural employment jobs in Montana saw incomes go up by 32% from 1950 to 1968. That might sound like a lot, but in Utah they’d gone up by 77% and in Colorado they went up by an astounding 91%.
Between 1950 and 1960 Montana saw a population growth rate of just 14%, which was 4% below the national average. From 1960 to 1968 Montana’s population grew by only 2.5% compared to the national average of 11%.
During those same years, employment rose 15% nationally but just 7.4% in Montana. Prices in Montana also went up, increasing by 25.8% from 1959 to 1969.
The Montana unemployment rate in 1965 was 4.6%, down significantly from the 6.7% average of the recession year of 1961. By 1968 it was down to 3.6%.
During these years Montana saw derivative employment rise as primary employment was lost. Derivative employment consisted of:
“Wholesale and retail trade; the service industries such as barbershops, laundries, hotels and motels, and the like; finance, insurance and real estate; truck, bus and air transportation; construction; and state and local government.”
In Montana in 1970 there were 85,100 people employed in primary industries and 180,600 people employed in derivative industries in the state. Some key industries were farming, with 36,100; manufacturing with 23,900; trade with 48,100; and government with 40,700.
By 1974 there were 86,400 working in primary industries and another 215,300 employed in derivative industries.
Some key differences were that farming had lost 1,000 jobs, manufacturing had gained 400, trade had gained 11,000, and government had gained 4,500.
Service and finance jobs were another big winner, going from 41,800 in 1970 to 53,400 in 1974. Railroads, however, lost 100 jobs. Mining picked up 900 jobs during that time, for 7,500 total mining positions in the state.
Even in the 1970s there were warnings about this trend. Maxine Johnson and Paul Polzin predicted in the Montana Business Quarterly in 1976 that “not only do service and trade industries normally pay low wages, but many of the new jobs were part-time.”
Of the new jobs created during that time, 25% were in Billings and another 25% were split between Missoula and Bozeman. Those areas had just 31% of the state’s population yet they were creating half the state’s jobs.
The recession of the mid-1970s really hit Montana hard in 1975 when 2,900 primary industry jobs were lost. To make up for this, all levels of government hired, creating 6,400 new jobs.
Factoring in the local, state, and federal jobs lost during those recession years, however, and this created a net gain of just 3,500 jobs.
Professor Polzin went on to do a study in 1975 about the migration patterns of Montana workers. His findings revealed that “those in the most productive years between ages 15 and 64” were the most likely to leave the state.
He looked at the years 1965 to 1970 and found that many “who left the state would have preferred to remain, but could not find employment in Montana.
In 1972 Polzin did another study and found that 42% of the state’s college graduates expected to leave.
In 1950 Montana’s per capita income was 8% above the national average, Malone tells us. By 1970, however, it had fallen to 12% below the national average and by 1988 that was 22% below.
“This has meant a deteriorating standard of living for Montanans and a severe threat to their future. Although Montanans indisputably enjoyed a higher standard of living in 1990 than they did in 1920, they have also indisputably failed to share in the new era of national economic evolution. If the state continues to follow its old-fashioned ‘low-tax, low-service’ approach to its political economy, thereby failing to invest in order to build and compete in a global economy, the deterioration will continue to deepen.”
Notes
Bigart, Robert. Montana: An Assessment for the Future. University of Montana Publications in History: Missoula, 1978. p 42, 57-60, 64-70, 102.
Malone, Michael Peter; Roeder, Richard B.; Lang, William L. Montana: A History of Two Centuries. The University of Washington Press, 1976. p 346.

