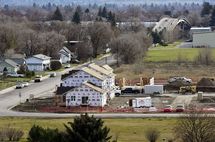
 Near Scott St.
All of this comes from the 337-page City of Missoula’s Comprehensive Annual Financial Report & Audit For the Fiscal Year Ended June 30, 2016.
The CAFR.
On page 277 of the CAFR you’ll get to the statistical section.
Here we can get a comparison of revenues and expenses for the years 2007 to 2016 when it comes to the city’s net position.
For instance, in 2007 total primary government expenses were $47.4 million.
In 2016 they were $78.3 million.
Program revenues in 2007 were $26.4 million. In 2016 they were $31.1 million.
When it comes to the net position of total primary government, in 2007 it was $11.9 million and in 2016 it was -$2.7 million.
We’re going in the wrong direction here, folks.
Let’s look at the city’s net position.
Net position expenses continue to outpace revenues, but unlike in 2007 they’re wildly out of control.
In 2007 there was a $21 million discrepancy between income and expenses, but by 2016 it was $47.2 million.
During that same time the city’s income has only increased by $4.7 million.
When it comes to the city’s general fund, in 2007 we had $2.1 million and in 2016 we had $5.4 million.
Let’s look at governmental funds and revenue.
For all other governmental funds, in 2007 we had $4.9 million and in 2016 we had -$3.7 million.
So in effect, 10 years ago the City of Missoula had $7 million in the bank, but by 2016 they had just $1.7 million.
The governmental funds are generating more revenue, as in 2007 they brought in $47.5 million and by 2016 they were brining in $66.7 million.
Back in 2007 the city made the most revenue from taxes ($24 million) followed by intergovernmental ($13 million) and then charges for services ($4.5 million).
By 2016 the city made the most revenue from taxes ($34 million), then intergovernmental ($19 million) and finally charges for services ($7 million).
Fines have remained steady, at about $1.5 million each year.
Let’s get to expenses.
Back in 2007 general government cost $5.7 million and by 2016 it was costing $10.8 million.
Public Safety was $19.8 million in 2007 and in 2016 it was $29.2 million.
Public Works was $6 million in 2007 and $10.5 million in 2016.
If we move on a bit further we find that the assessed value of city property was $2.9 billion in 2007 and $7.3 billion in 2016.
Let’s look at new construction.
There were 303 single family homes being constructed in 2007, with a value of $31 million and 195 single family homes in 2016 with a value of $20.3 million.
In 2007 we had 153 multi-family homes under construction, with a value of $7.5 million and in 2016 we had 150 with a value of $9.6 million.
What’s interesting is that we actually had fewer construction projects in 2007 (1,613 of them) compared to 2016 (1,515 of them) but they’ve gone way up in value for those years…$89 million to $117 million.
Let’s take a quick look at various funds.
Here’s what we have for total funds required for the year:
- General Fund: $62 million
- Special Revenue Fund: $26 million
- Debt Service Fund: $3.7 million
- Capital Projects Fund: $2.9 million
- Sewer Enterprise Fund: $25 million
That's $119.6 million. Please remember - the city only takes in $60 million in revenue each year.
Here’s the end-of-year fund balances:
- General Fund: $4.7 million
- Special Revenue Fund: $7.1 million
- Debt Service Fund: $3 million
- Capital Projects Fund: $2.9 million
- Sewer Enterprise Fund: $8 million
Just $25.7 million left over.
Here’s how much each fund needs to collect in property taxes:
- General Fund: $23 million
- Special Revenue Fund: $7.7 million
- Debt Service Fund: $1.2 million
- Capital Projects Fund: $0
- Sewer Enterprise Fund: $0
That comes to $31.9 million that the city needs to take from you so it can continue its downward trajectory.
Let’s take a look at Missoula’s largest employers.
When it comes to the taxable value of Missoula’s principal property taxpayers, it looks like this:
- Northwestern Energy: $5.3 million
- Mountain Water Company: $1.6 million
- Century Link: $1.2 million
- Charter: $1.1 million
- RCHP Billings Missoula: $1 million
- Southgate Mall: $969,000
- Verizon: $877,000
- Montana Rail Link: $765,000
- Gateway Limited Partnership: $693,000
- St. Patrick Hospital: $412,000
Those 10 companies make up 12.7% of Missoula’s tax revenues.
Of course, Mountain Water’s $1.6 million is now gone to us.
We can also see that in 2007 the City of Missoula made $19.8 million from tax levies but in 2016 they were making $27.8 million.
Here’s what it looks like for top employers in Missoula when it comes to the number of workers:
- UM: 2,897
- St. Patrick Hospital: 1,542
- Montana Rail Link: 1,167
- Missoula County Public Schools: 1,113
- Community Medical Center: 905
- Missoula County: 852
- US Forest Service: 693
- AT&T/DirecTV: 675
- Wal-Mart: 585
- City of Missoula: 546
Back in 2007 UM had 311 more workers than it did in 2016.
Community Medical Center had 345 more.
Most of the other businesses have increased their workforce.
Missoula County has 201 more workers than it did in 2007.
The City of Missoula has 50 more workers than it did a decade ago.
And there you have it – a big pile of tax stats!
Have a nice day.

