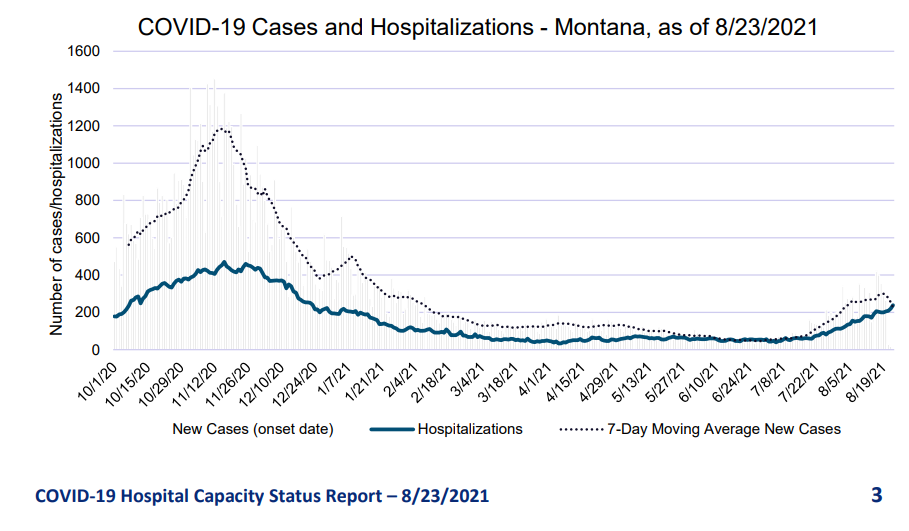
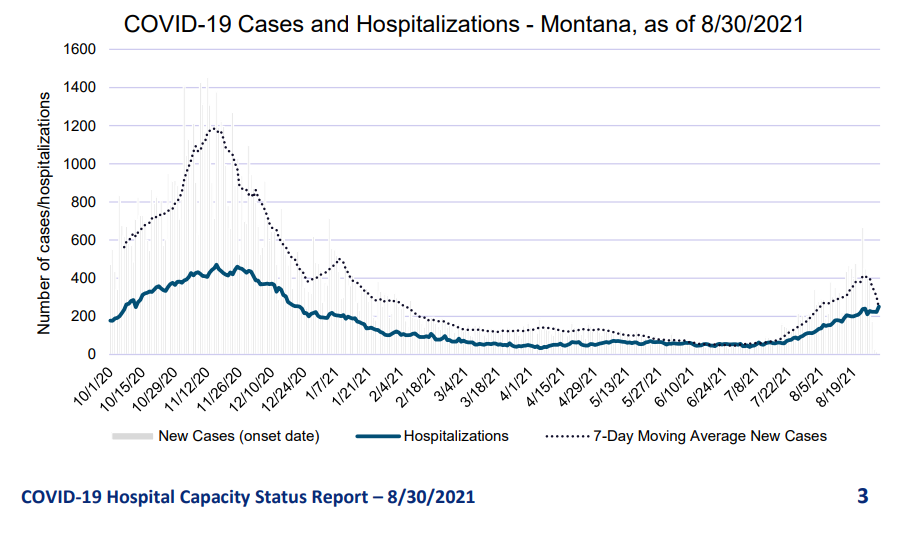
We’ll compare this to the August 23 report.
You can find more info and analysis in the posts we had about this on Aug. 19 and Aug. 24, when we found out the hospital executives were in fact inflating their covid numbers in the media, something the reports proved was not true.
I wrote a letter-to-the-editor about this issue, but they refused to publish it.
Let’s compare the numbers over this most recent week compared to the one before.
In mid-August, Montana had 1,940 people in the hospital, statewide. That included 239 covid patients. That week, we had 870 beds available across the state.
By the last week of August, Montana had 1,867 people in the hospital statewide. That included 251 covid patients. That week, we had 902 beds available across the state.
So from one week to the next, the state saw a 4% drop in total patients hospitalized, though we did see a 5% increase in covid patients. Bed availability actually went up by 4%.
What about the supposed covid hotspots of Bozeman and Missoula, the latter of which has the highest vaccination rate in the state?
Bozeman had 14 covid patients mid-August, but by the final week they had 12.
In Missoula’s Community Medical we had 6 covid patients mid-August and by the last week we had 7. At St. Pat’s, we had 15 and 20, respectively.
Bozeman went from 13 beds available to 7, while in Missoula the two hospitals went from 78 to 67 and 68 to 77, respectively.
So over the course of a week in two of our major cities, we saw covid cases fall in Bozeman but jump 25% at one hospital.
It sounds like a lot, but putting it in perspective...that’s five new patients. At the other Missoula hospital, they got one new covid patient.
The ICU is where it gets a little iffy.
In Bozeman, they went from 7 covid patients in the ICU to 6. In Missoula, it went from 3 to 6 at Community and 2 to 5 at St. Pat’s.
The Billings ICU has it pretty bad, with covid patients in the span of one week going from 13 to 19.
In all the hospitals, the vast majority of ICU patients don’t have covid.
Finally, here are the two graphs from the reports, showing hospitalization trends over the last two weeks of August.
As we suspected, overall hospitalization rates have begun to plateau, while case counts across the state are beginning to drop.
This is indicative of what we’re seeing in other parts of the country when it comes to the delta variant.


