It was put on by Senator Tester and you can read the full profile of Montana small business manufacturing here.
One thing you may remember is how many booths were set up outside the event.
One of those was manned by Andy Shirtliff for Choose Montana.
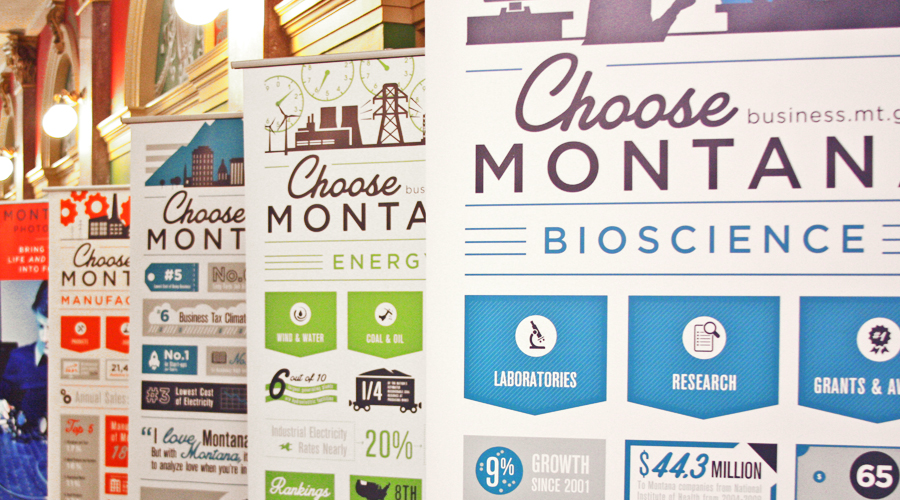
Choose Montana is an initiative that was started by the Bullock Administration to spur small business growth, entrepreneurship, and investment in Montana.
Something that’s really cool are the flyers for this campaign. They look slick and they impart a lot of information in a fun way.
Really, they’re modern-day infographics that look great on flyers or around info-kiosks at events. Hell, I think they’d be great to have at our rest stops, especially those near the borders.
Alas, I did not get around to writing a post about these awesome Montana business numbers.
That changes today. Stand back and prepare to be amazed by Montana’s business and agricultural capabilities.
Montana Business Stats for 2014
- 5th Lowest State for the Cost of Doing Business
- 6th for Long-Term Job Growth
- 6th Best Business Tax Climate
- 1st in Start-Ups per Capita
- 7th in Academic R&D Intensity
- 9th in STEM Job Growth (Science, Technology, Engineering, Mathematics)
- 3rd Lowest Cost of Electricity
- AA+ Moody’s Credit Rating
- 1st Best Place to Live the American Dream
- 1st for Increasing College Graduates with a 2-year Degree
- 3rd for Export Integrity
- 4th for Export Growth
- 1st in High School Diplomas or Higher for Adults
- 6th in Road Quality
- 18.4 minutes is the Average Commute Time
Montana Science & Technology Stats for 2015
9% Job growth since 2001 in Montana
9.2% Job growth in the Bioscience industry from 2001 to 2010
$44.3 million given to Montana companies from the National Institute of Health from 2004 to 2009
65 National Institute of Health grants awarded to Montana
$52,160 is the average annual wage in Montana
11 National Institute of Health-funded institutions in 2012
$29.5 million invested in bioscience companies by venture capital firms from 2004 to 2009
$24.6 million in National Institute of Health funding awarded to the Montana University System in 2012
$44.6 million in photonics exported internationally from Montana
38 fiber optics firms in Montana
Photonics are the 9th highest export in Montana (photonics is the generation and controlling of photons (particles of light) which are used today in smartphones, laptops, medical instruments and lighting)
28 optic firms in the Gallatin Valley, creating an “Optics Cluster” (highest concentration in the country)
Most photonic companies have formed since 2000
Montana Agricultural Stats for 2014
28,000+ Farms and Ranches in Montana
2.5 Beef Cattle for Every 1 Person
1.93 million pounds of wool produced in 2012 in Montana
$2 billion added to the American economy by Montana farmers
2 million acres of irrigated farmland in Montana
#8 in the country for cows
#6 in the country for beef cows
2,056 acres is the average farm or ranch size in Montana
$4.7 billion in revenue is generated from Montana agriculture
Live Animals are our #11 export
#2 in the nation for honey production
#10 in the nation for sheep, goats, and sheep/goat products
18,000 dairy cows in Montana
16,833 pounds of milk produced in Montana each year
65.9% of Montana land is used for farms or ranches
#1 in pea and lentil production
#2 in durum production
#2 in safflower production
#3 in barley production
#3 in wheat production
#3 in chickpea production
#3 in alfalfa hay production
#3 in flaxseed production
Montana Tourism Stats for 2014
$3.9 billion spent by tourists in Montana, up 7.6% from 2013
38,220 jobs are directly supported by Montana tourism, up 13.5% from 2013
53,280 jobs created from Montana tourism (directly, indirectly, and induced (induced jobs are created through the commercial activity of the business))
$1.3 billion created in employee compensation from the Montana tourism industry
$218 million in state and local taxes is generated by tourism, down 7.8% from 2013
$530 is the amount of money Montana tourism lowers individual property tax bills by, down 2.2% from 2013
45% of tourist spending in Montana takes place in Gallatin, Flathead and Yellowstone Counties
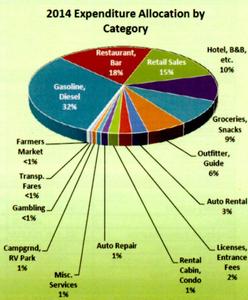
$1.2 billion spent on gas by tourists in Montana
$710 million spent on restaurants
$598 million spent on retail sales
$388 million spent on hotels
$352 million spent on groceries
$243 million spent on outfitters and guides
$96 million spent on car rentals
$79 million spent on licenses and entrance fees
$62 million spent on rental cabins and condos
$41 million spent on car repairs
$30 million spent on miscellaneous services
$24 million spent on campgrounds and RV parks
$18 million spent on gambling
$7 million spent on transportation fares
$6 million spent at farmer’s markets
Conclusion
We lead the nation in many categories, and if we don’t, we’re right up there in the Top 5 or Top 10.
That’s impressive. More, however, it shows that we work hard.
Here in Montana we have the ability to produce in-demand products consistently and better than our competitors. We set the standard in many categories and others look up to us for guidance, and in admiration.
We have a lot to be proud of in Montana and these numbers show that.
Montana is a great place to do business. I think the campaign says it all, and the numbers back it up:
Choose Montana.


