No, what’s really bothering me are the discrepancies in U.S. Census data concerning Montana. This is making it difficult for me to gather the data I need to write my 5th book on Montana history. In other words, it’s pissing me off.
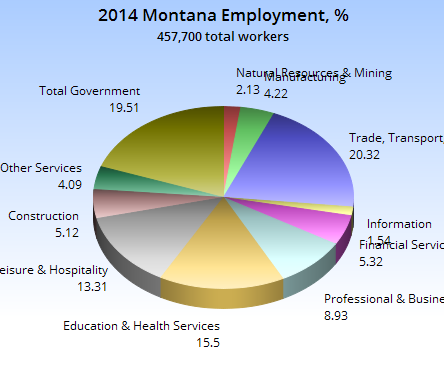
Here, before we get too far into it, take a look at this graph of Montana employment for 2014:
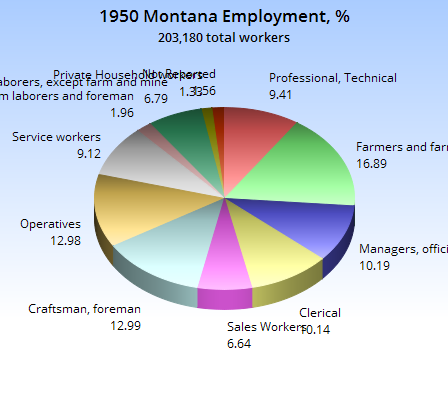
But how did we get there? That’s rather easy to tell – just look at the numbers for each decade and do the math and then the analysis. But the problem is…those categories aren’t matching up.
Here, take a look at an employment graph showing Montana’s workforce in 1950:
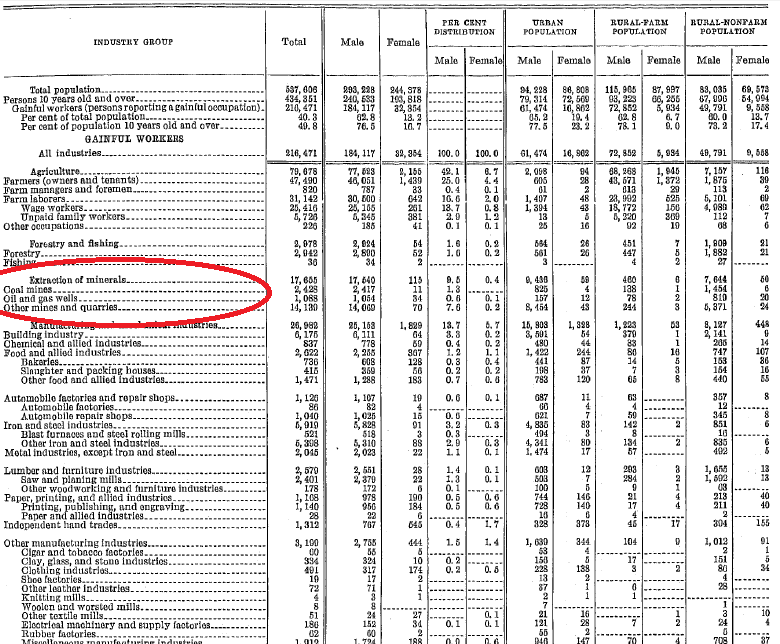
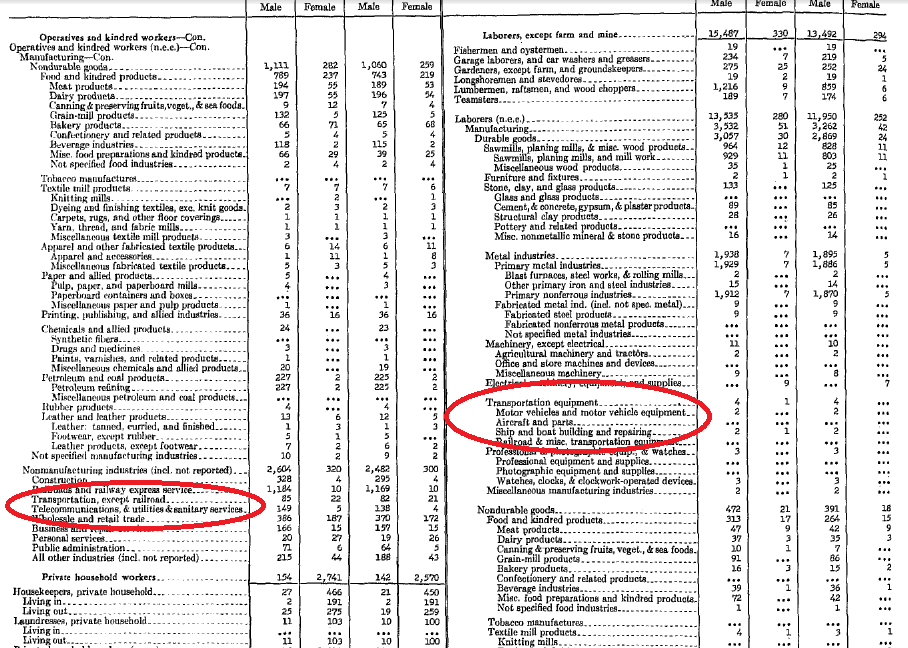
I will say that I love the 1930 Census – it’s got everything in one document! Starting around 1950 they change this and you get housing and population and employment in different places. Huge pain in the ass! Another one is how they changed the categories. Here’s mining for 1950:
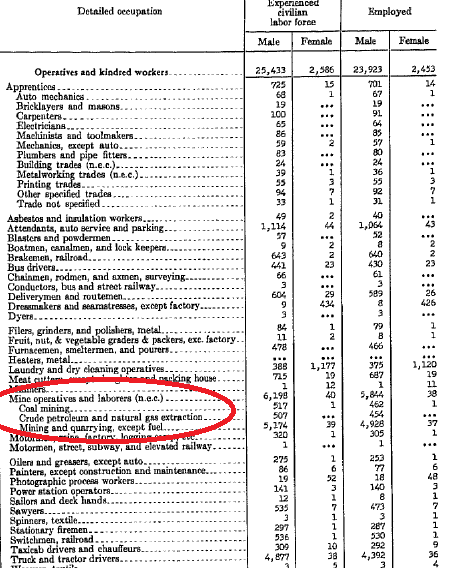
Why does this matter? Because you get other jobs in the 1950 Montana Census report that look like this:
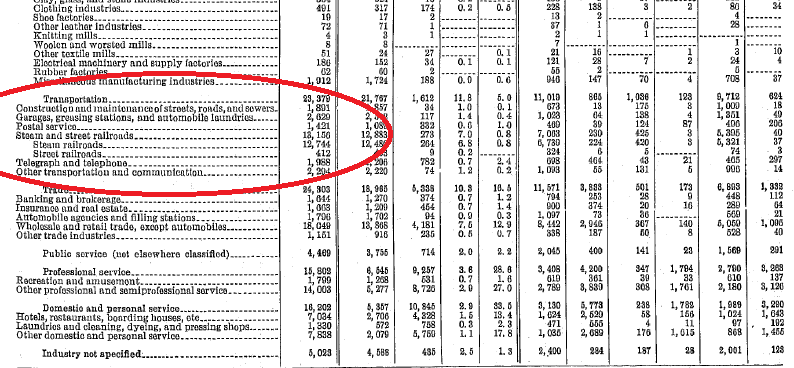
Here’s what transportation in Montana looked like in 1930:
I’ll get through it. I just need to think about it for a bit and figure out how I want to report job numbers, and in a way that makes sense and is aligned with the data. All in all, I want to have graphs for Montana employment that have the exact same categories for each decade. That’ll take some work.
And really, should I do that? Is anyone interested in this? I think so. I think digging through those boring pages is worth it, because you get interesting things like this:
- From 1940 to 1950, Montana increased its number of bartenders by 215%;
- Local public administration in Montana increased by 2,436% from 1940 to 1950;
- Montana had 657 judges and lawyers in 1950, up from 138 in 1940, an increase of 476%;
- In 1950 there were 326 male stenographers and 4,136 female stenographers;
- In 1930 there were 6,893 telephone and telegraph operators in Montana and in 1950 there were 1,756, a decrease of 392% (the reason I include telegraph is because in 1930 that was lumped in with telephone).
- In Montana in 1950 there were 213 female librarians and 11 male;
- In Montana in 1950 there were 148 radio operators, up from 99 a decade earlier, or an increase of 149%;
- Montana had 276 dentists in 1950.
Perhaps you can see some themes here, or maybe you can tell how this story will unfold. Radio and television weren’t discussed in our last volume, for instance, and I’m gathering numbers to tell that story. Those numbers will come in handy when we transition to the internet in the 7th and final volume of this history.
We began to tell the story of the automobile in Montana in the last volume of this history, and we’ll continue that story with the construction of the Interstate Highway System.
Boy, it’s a lot of work. And remember, no one is paying me for this. Hell, I’m not even getting some cushy advance from a publisher – there are no publishers interested in a history of Montana.
No, I’ll just do what I’ve always done on these books, and that’s wait for a month when I know I’ll have enough money to pay the rent, and then just go full-bore. That’s this month.

