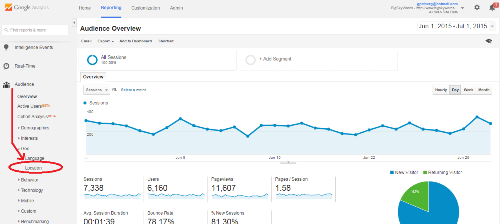
Here’s where you’d find that on the main screen:
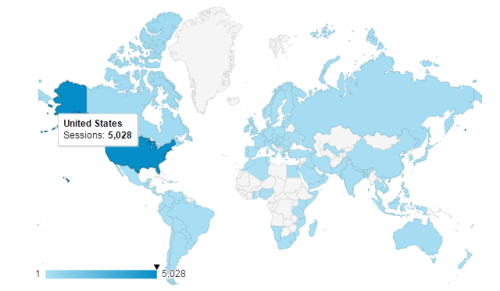
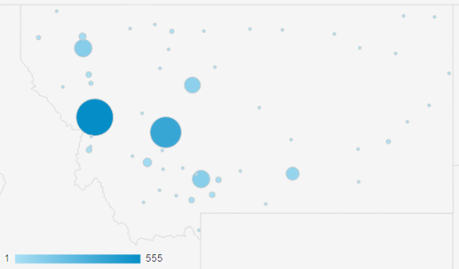
You can see that by hovering over the area, and you’ll also see the maximum on that bar on the bottom left-hand corner of the screen.
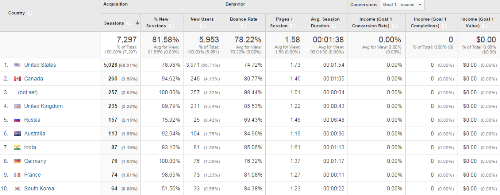
Besides that, you’ll get a detailed spreadsheet of information below the map.
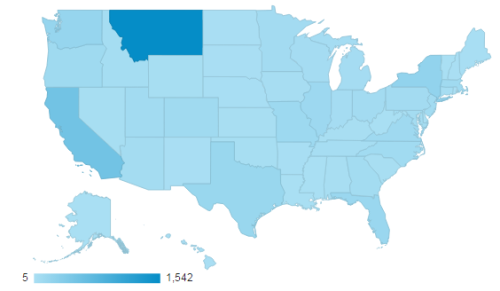
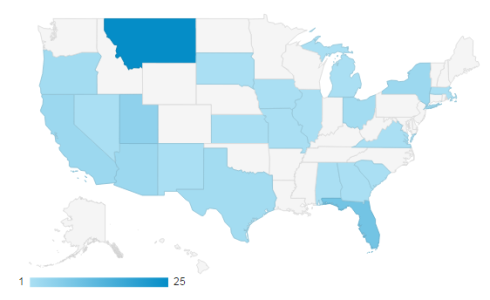
I also know that the smallest geographical area on the map (a state in this case) only gave me 5 hits. I’ll also get that cool spreadsheet to tell me bounce rate and average session duration, like we saw above.
So it’s clear that Montana is the state I’m getting most of my traffic, which isn’t surprising – I write about local politics and the state’s history.
A lot of my evergreen content is geared towards the state as well.
Missoula: 555
Helena: 384
Kalispell: 121
Bozeman: 117
Great Falls: 100
Billings: 32
There’s one other major city in the state, and that’s Butte, which is giving me 28 hits. Again, all of that is given to me in the spreadsheet.
Global hits went from two 5,028 to 4,583, a drop of about 9%. For the US, my traffic had gone from 1,542 hits to 1,406, the same 9% drop.
For my traffic in Montana, it decreased as follows:
Missoula: 487
Helena: 334
Bozeman: 138
Kalispell: 131
Billings: 79
Great Falls: 62
So we have a slight drop in my lead city of Missoula, as well as my second largest city, Helena. Bozeman has gone up enough hits to overtake Kalispell as the third largest metropolitan market I have.
Billings has also moved up, quit significantly over Great Falls. Butte has fallen from the rankings entirely, and has actually been taken over by a different city, Livingston.
Why did this happen?
In June I put out a total of 40 posts on my site, while in July I put out 28 and in August I put out 35. That may have cost me, and I feel that it being August, the last month of summer, also cost me.
I personally feel that many sites feel a slight dip during certain times of the year, such as the last month of summer and around holidays like Christmas.
This Webmaster World commentary from 2006 seems to bolster my argument.
I’m sorry, but for some unknown reason, there are hardly any articles on the affects of summer on website traffic.
Analyzing Social and SEO Trends with Geo Analytics
For instance, I could be targeting these cities with my statewide SEO services. Something we talk about on my site a lot is politics, so if it’s an election year and you’re running a statewide campaign, this could be very helpful.
Tracking where your campaign website is doing well and in what cities it’s not can be the make-or-break in an election today.
That’s why that extra city of Butte interested me. That’s a Democratic stronghold, and if my site isn’t doing well there, that’s a problem.
I need it to do better there, so that might mean some content geared toward that city’s news stories, or a service that’s missing, or even some image posts that might pull in hits from Google Image (one of the most underrated traffic generators, in my opinion).
The point is, you’ve got a wealth of information here with this Geo Analytics tracking on Google Analytics. An added bonus is that graphical user interface.
Let’s face it – Google Analytics can be off-putting. The more graphs and visual representations of numbers, the easier it is, and the more people will use it.
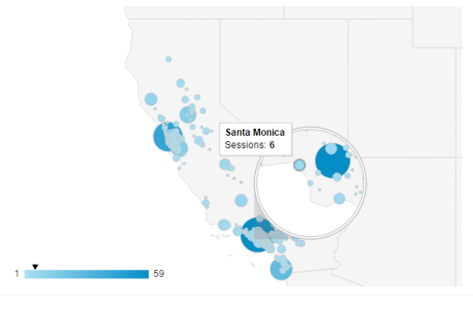
Let’s take a look at another example, this one looking at California. I get very few hits from this state, just 59.
But wow, look how things are so much more clustered together than they were in Montana!
How would you use Google Analytics and their Geo Analytics function to figure things out…or even keep your head from exploding?
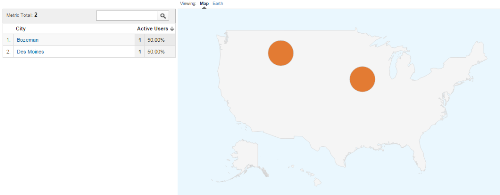
I went in a couple days after these initial maps and looked at just that day, July 3. It was only 3:00 PM when I did so, and I’d had 110 total sessions, 71 of them (65%) coming from the US.
The most hits are still coming from Montana, but with just 25, we know it’s only 35% of my total traffic for the country. Florida, not California today, looks like it’s giving me quite a bit of traffic, 9 hits, but still 12%.
What’s going on there?
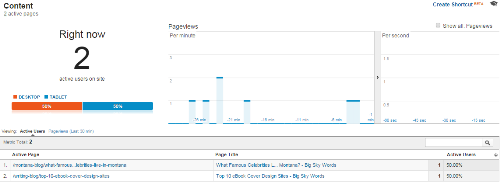
For that you’ll have to stray over to the “Content” section of Google Analytics. In my case, they were looking at one of my evergreen articles, one on eBook cover designers.
Chances are good that some friends in Florida sent messages on social media about that article. It might be a good idea for me to include a Florida writer’s hashtag the next time I promote that post.
Real-Time Geo Analytics
When you know your social media posting schedules and you’re in the midst of a hot campaign – perhaps one that’s butting right up your competitors’ – you can react quickly, see what’s working and what’s not, and act accordingly.
Want more information?
The New Geo Network Dimensions in Google Analytics was a February 2015 post on Daimto that has some tips that explores this more.
How to Navigate the Google Analytics Location Report was a June 2013 Search Engine Watch report with some tips as well.
Both are great resources for increasing your knowledge about this.
Conclusion
If you have a business, or political campaign, you’ll want to look into what Geo Analytics can do for you. All of these features are in Google Analytics now, and you can use them for free.
If you have a team, someone should be on this, figuring out how to get your message out better so it benefits our goals.
If you’re a solo entrepreneur, Geo Analytics allows you to see smaller markets and how they react to your content. This allows you to tailor advertising to the utmost effect, saving you time and money and a lot of frustration.
Like most cool features that are pointed out to you, however, probably the hardest part is just using them. It’s easy to nod our head and say, ‘wow, I should do that,’ but sadly, so few of us do.
Don’t let that happen this time. Start looking into your Geo Analytics with Google Analytics. Your site and business will perform better as a result.


















 RSS Feed