
Which were the best?
Lots of big sites will put up their wrap-up posts in the coming weeks.
This is one of those posts.
It’s also an excerpt from my book Get Noticed: Your 2016 SEO, Social Media, and Content Marketing Guidebook.
Check it out on Amazon or iTunes.
If you like these 15 posts, please buy a copy when it hits shelves this Wednesday.
Thanks!
#1 Social Media Poll
Martin Beck had a post on January 13 on Marketing Land called Survey: 70% Of Marketers Plan To Boost Social Spending In 2015. In it he says that 84% of marketers “plan to increase or maintain overall digital spending,” with 70% of those saying mobile is “critical.” Another surprising number is that 71% of marketers now believe that social media marketing “is core to their business.”
When you get into the various social networks, it’s clear Twitter is in the lead with 70% of people saying it’s effective, compared to the 56% that Google+ gets. Considering we’re asking 5,035 “global marketing professionals,” that’s important information to know.
#2 Rubbish Likes
Matt Southern had a good post on Search Engine Journal on March 27 called The Biggest Losers in Facebook’s Recent Purge of Page Likes. In it he talked about the March 11 decision to get rid of inactive likes on people’s business pages.
A big part of this was the lack of engagement for pages with huge numbers of likes, something that was reducing them in the rankings. Often this was no fault of theirs, just the exuberance of their customers. And Facebook caused exuberant customers to hurt businesses. Wow, what a mess.
Southern says that 10% of likes for some businesses were rubbish. The biggest rubbish artist is singer Rihanna. She has 7.9 million likes…or does she? There’s 9 more “artists” to check out, and 10 brands as well (YouTube is the worst on the latter). I like this post, and there’s a lot of potential to run your competition through the ringer. Sally forth!
#3 Social Scheduling
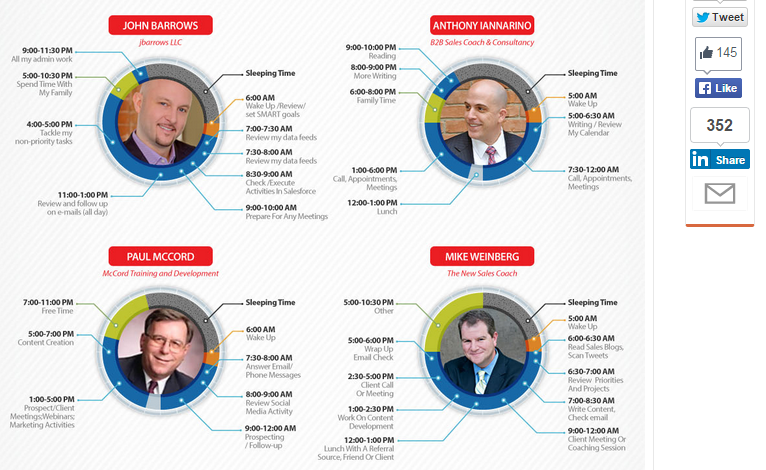
A really good post on March 28 was called How 16 of the Most Successful Social Sellers Schedule Their Days [Infographic]. It was put together on Hubspot by Emma Snider and the layout is pretty cool, if a little difficult to read. Take a look at this sample:
I left that social bar there so you can get some scale. As you can see, experts tell about their day. I always look at email times, myself. Is the person constantly checking or do they have a more refined approach, on that allows them to focus on tasks at hand as opposed to being ripped away every 2 seconds?
What are you looking for? Might want to take a look and see if you can find it in this infographic post.
#4 Epic Fails
Wow, who doesn’t want to drive by a car crash and stare? That’s what Albert Costill gives you in this May 12 post called What We Learned From These 15 Epic Social Media Fails. Highlights include:
– New England Patriots Twitter Fail;
– Bill Cosby’s Meme Fail;
– There are No Giraffes in Ghana;
– Is JC Penny Drunk?
I got a few extra laughs after going back and reading this post. For JC Penny, we’re talking about a Super Bowl Twitter campaign, one with typos that were planned. It may have worked, had not “the quick-witted responses from other brands” stolen some of the show. This is a fun read, so click over there.
#5 More Productive, Socially
Neil Patel had a useful infographic post on Quick Sprout on May 15 called How to Be More Productive on Social Media.
In it he lays out tips and strategies to make your 3.6 hours of daily social more productive. Yeah, that’s the average amount someone under the age of 50 usually spends on social each day. Get more fun facts by checking out this post.
#6 Companies on Facebook are Off-Putting
Report: 87% of Facebook Customer Messages Are Ignored was a June 24 Marketing Land post by Greg Finn. It pretty much tells me what I already know – I skip adds and say “don’t show me this again.”
This post might be a bit more scientific than that. They looked at 900 different Facebook pages and besides the earlier stat, found just 37% of companies answered all posts.
Wow, talk about clueless, huh? Just goes to show how far ahead you and your site are. So why don’t you get the traffic lovin’ like the Big Boys? Good question…and not for this post.
#7 Social Media Users & Addictions
Social Media Addiction Statistics [INFOGRAPHIC] was a June 26 post on Social Media Today by Carianne King. There are lots of good stats in the post, like:
– 2.03 billion people are using social media, or 28% of the world’s population;
– Facebook has 1.3 billion users;
– Google+ has 343 million users;
– LinkedIn has 300 million users;
– Twitter has 271 million users;
– Tumbler has 230 million users;
If you’re a teenager you spend about 3 hours a day on social media, and collectively, around the world, we spend 39,757 years of time on Facebook in just one day.
Wow, and I’m only halfway down the infographic! I think you’ll want to check this one out.
#8 Insights from Competitor Research
10 Helpful Insights From Your Competitor’s Social Media Strategy was a June 30 post by Kristi Hines on Sales Force Canada Blog. Those insights are:
– Which networks do competitors use?
– How do competitors position themselves?
– What types of visuals do competitors use?
– How often do competitors post?
– What do competitors post?
– What trends do competitors talk about?
– What do people say about competitors?
– What social plugins do competitors use?
– What groups do competitors join?
– Where do competitors publish content?
Wow, lots of stuff to think on. The post gives you about a paragraph on each of those and I encourage you to give it a look.
#9 How Much Money is Facebook Making?
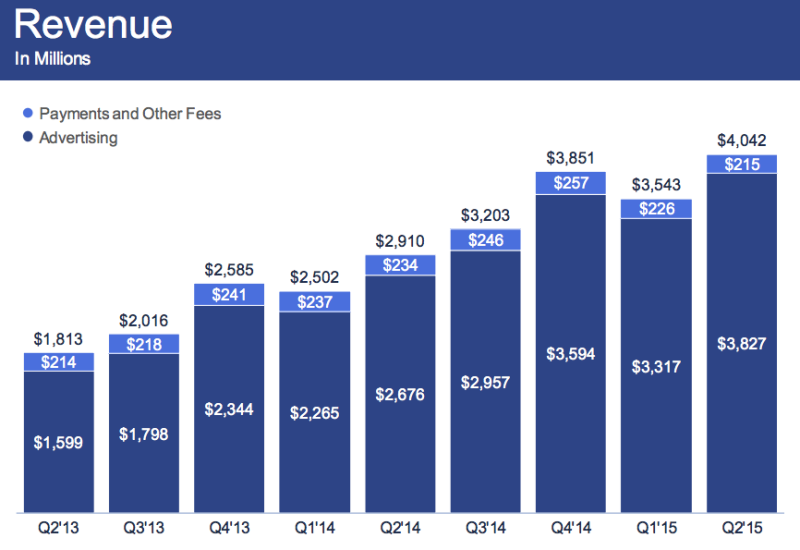
Facebook Beats Estimates With $4.04 Billion, Mobile Nearing 80 Percent was a post by Greg Sterling on Marketing Land on July 29. In it he talks about Facebook revenue, which looks like this:
Can I tell you something I hate? Its graphs that say “in thousands” or “in millions.” Just put the damn number, will ya – this ain’t math class!
So what we have is Facebook going from $1.8 billion in revenue in early 2013 to over $4 billion in early 2015. Virtually all of that growth is due to advertising revenue. Now you know why your posts aren’t as effective as they once were – Facebook is charging you for what you used to get for free.
Another graph I like is the one that shows mobile users on Facebook. The site has gone from 469 million in 2013 to 844 million in 2015. According to Mark Zuckerberg, users spend about 46 minutes a day on the site. Good info, and you’ll find a lot more in this helpful post.
#10 Increasing Google+ Engagement
Eric Enge had a August 12 Stone Temple Consulting post called Maximizing Engagement on Google Plus. He points out that Google is changing some features, making it so you don’t need a Google+ account for various Google programs.
He then tells how he analyzed more than 33,000 posts to figure out the “nature of their content.” What he’s trying to figure out is how Google+ will do thing as it becomes “more tightly focused on connecting people around common interests.”
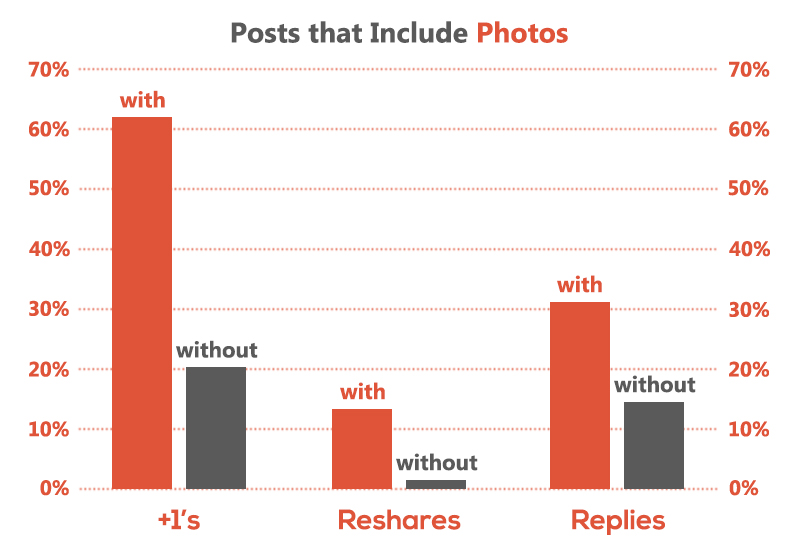
What I really like about the post, however, are these cool graphs:
Enge looks at how photos affect shares and reshares and all the rest of it. You get info on how hashtags affect posts and also how mentions and videos do. I’m pretty impressed with this post, both because of the amount of data analyzed and how it’s presented. Good job!
#11 People to Avoid on Facebook
10 Types of Friendships that You Should Avoid on Facebook was a September 7 Hub Spider post by Luca D’Angelo.
I really enjoyed this post because it’s fun and funny. Some of those you should avoid include:
– The tagger;
– The social depressed;
– Hashtags and emoticons addicted;
– Farmville player;
– Your mom.
You’ll get a paragraph on each of those and I encourage you to look. Honestly, though – you’ve probably come across most of these folks before and know the warning signs. Be careful out there.
#12 Increasing Your Social Reach
On October 13 Ash Read told us that as little as 2% of our Facebook and Twitter posts may actually be seen.
The post was called How to Understand and Maximize Your Reach on Any Social Network and appeared on Buffer Social.
He talks about potential reach (the number of followers you have) and actual reach (the amount that give a damn). So how do you increase that reach? After all, if you have 1,000 followers but only reach 20 of them on any given day, why go on?
It’s hard, but Read gives you tips on many of the hottest networks. On Facebook, for instance, you could narrow your audience or embed your posts. For that first one you get a cool video-gif showing you how to do that.
All in all, this post is good for giving you ideas on increasing reach. You might think a lot of people are listening, but chances are they’re not. Change that by implementing these ideas.
#13 Stats for All the Social Networks
25 Social Media Facts for the End of 2015 was a great stats post by Brian Harnish on Search Engine Journal on November 3. Here are some highlights:
– Twitter has 316 million monthly users and 88% of them are active on mobile devices;
– Facebook has 39 billion active monthly users (how is that possible?) and 510 comments are posted every minute across the network;
– More than 69% of Pinterest users are women and food gets 57% of the network’s discussion.
Wow, quite the numbers! I encourage you to give this post a look. It’s a good one for getting stats all year for your own posts. Check it out!
#14 The Monetary Value of Social Traffic
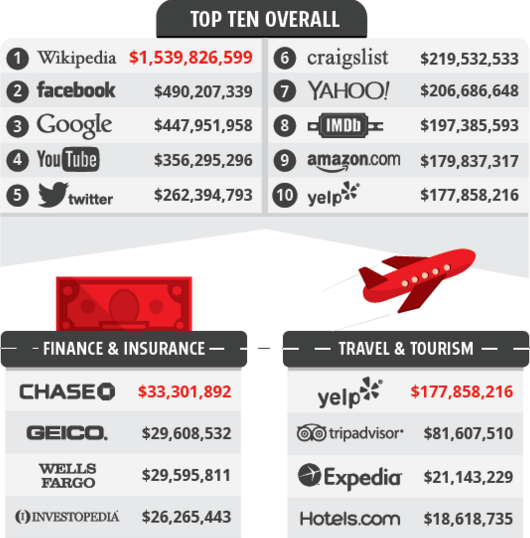
A fun post I really liked was November 8’s Search Engine Journal post by Kelsey Jones. It’s called Who Has the Most Valuable Traffic? [Infographic]. Here’s what it looks like:
Pretty cool, huh? I’m not sure if you can benefit from this but it does give you a good idea of what you’re up against for tons of industries.
For instance, Wikipedia is pulling in $1.5 billion a month while Target only gets $25 million a month. Give it a look.
#15 Social Stats for Customer Service
24 Statistics That Show Social Media Is the Future of Customer Service was a November 11 Social Media Today post by Mike Schneider. Some of those stats are:
– 67% of customers now use Twitter and/or Facebook to reach a company;
– 60% of B2C companies respond to customer tweets;
– $41 billion is lost each year by companies through shoddy customer service.
There’s a lot more in this post and I hope you look at it. I can’t believe companies would piss so much money away each year. Just hire some fucking interns and have them answer tweets.
Again, this is not rocket science. When you’re a bloated bureaucracy or head-in-the-sand company, however, it might as well be. When you get to be that size even the smallest and easiest decisions take teams to decide and weeks or months to implement.
You’re not like that.
You can get ahead, move with agility, and run circles around those clowns. Please keep doing that.
Conclusion
Those guys and gals did a really good job, and those sites did a good job getting those writers.
Maybe you could be one of those writers next year…if you’re not already.
Most of it comes down to being knowledgeable about social media marketing.
You can get that knowledge with posts like this. It’s a curation post and I’m sure you’ll see a lot more like it in the coming weeks.
You can see a lot more on Wednesday, too. That’s when I put up my Midweek Content Roundup posts.
I just gathered all of them together for the year and put them in a book. It’s called Get Noticed and you can get it on Amazon or iTunes.
Check it out, and use the ideas to get ahead in 2016.



















 RSS Feed