The pickings are ripe this year for a real change on the do-nothing Missoula City Council. I’d love to see the mayor go, and I’ve mentioned many times that recalling him is a much better option than letting the buffoon continue to sit in the mayor’s office.
It comes down to finances, and we just can’t have anymore traditional residents moving away to make way for the west coast transplants, legal industry assholes, and other schmucks from out of state. They might bring money, but the cost is subservience. All they want is the rich house on the hill, as many accessories as possible to fill it. Engen obliges them, and we’ve seen our manufacturing base disappear because of it while the American Dream has slipped away.
It’s a sad state of affairs in the ol’ corrupt mountain town, but like all scales of justice that have been terribly out of whack since time immemorial, a day of reckoning will come.
- Here’s the 389-page City of Missoula 2015 Budget Summary.
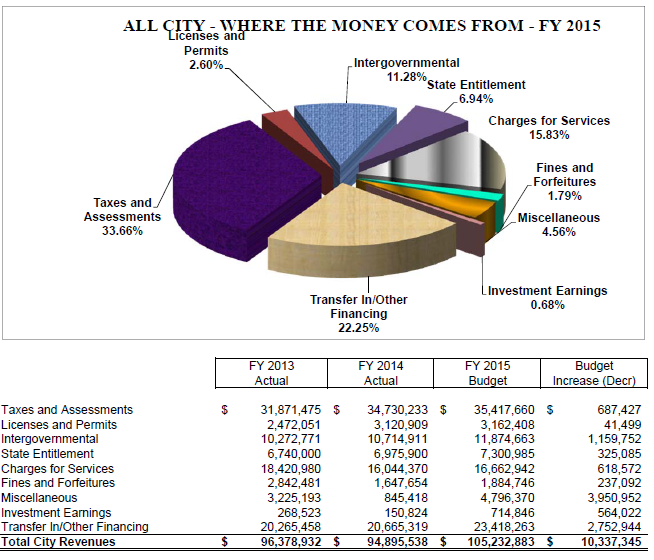
- Here you can see the Overview of Resources of the City of Missoula’s Budget for 2014-2015.
- Here you can see the Glossary of Terms for the City of Missoula’s Budget.
And here you can see a lot of graphs that I’ve chosen to talk about today:
- Taxes and Assessments: $35.4 million (33.6%)
- Transfer In/Other Financing: $23.4 million (22.2%)
- Charges for Services: $16.6 million (15.8%)
- Intergovernmental: $11.8 million (11.2%)
- State Entitlement: $7.3 million (6.9%)
- Miscellaneous: $4.7 million (4.5%)
- Licenses and Permits: $3.1 million (2.6%)
- Fines and Forfeitures: $1.8 million (1.7%)
- Investment Earnings: $714,846 (0.68%)
That’s a lot of money, $105.2 million to be exact. What’s more, that’s $10.3 million more than came in the year before, in FY 2014.
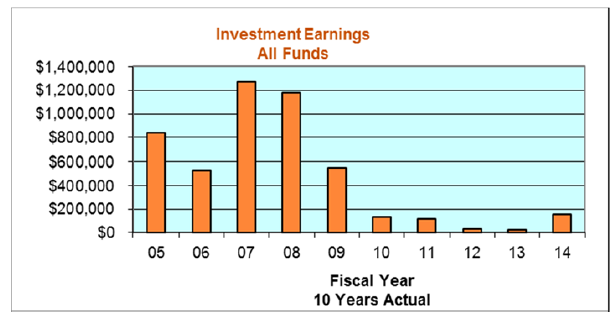
One area I find simply abhorrent is our Investment Earnings. These were all the way down to $268,523 in 2013, but thankfully have gone up by about $450,000 this year. Still, if you look at this graph, you can see that’s not good enough:
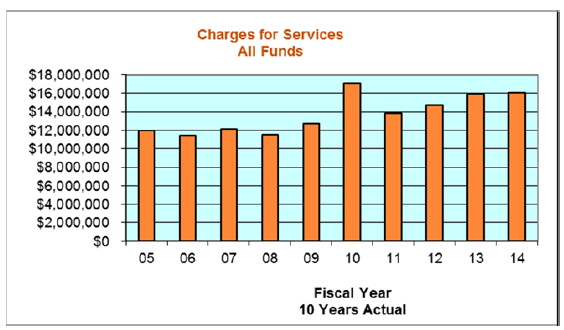
Another chart I’d like to point out is this one showing charges for services:
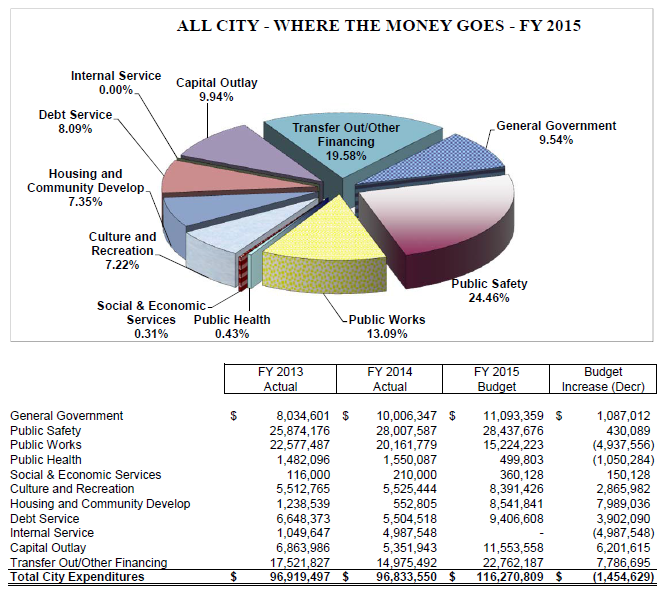
- Public Safety: $28.4 million (24.4%)
- Transfer Out/Other Financing: $22.7 million (19.5%)
- Public Works: $15.2 million (13%)
- Capital Outlay: $11.5 million (9.9%)
- General Government: $11 million (9.5%)
- Debt Service: $9.4 million (8%)
- Housing and Community Development: $8.5 million (7.3%)
- Culture and Recreation: $8.3 million (7.2%)
- Public Health: $499,803 (0.4%)
- Social & Economic Services: $360,128 (0.3%)
- Internal Service: $0 (0%)
A note on that Internal Service. As you can see, in 2014 we were spending $4.9 million on this. What the hell is it?
It’s the fund we use to pay for the City Health Insurance plan. As you can guess, more workers means more costs, and the mayor loves adding full-time employees (FTE’s). I still think there’s something funny about these numbers, as the explanation of costs over the past couple years in no way explains how this was accounted for.
On a lot of those other things, I have to be completely honest and say I don’t really know what they are. So I look. We can see that a lot of that Transfer Out spending is because of sewer issues, primarily dealing with bonds. The Other Financing seems to be more bond debt.
How about Public Safety? A lot of people like to blame the cost of having extra police, but we’ve gone from just 96 total sworn officers in 2005 to 109 in 2014. I’m positive we’ve hired more general city workers in that time. Over the same period, police calls have gone from 37,494 to 41,728.
I feel that a lot of these Public Safety costs are legitimate.
In 2005 we issued 1,494 building permits with a construction value of $99.8 million. By 2014 we’d issued just 1,319, and that construction value had dropped to $74.1 million. At the same time, Missoula’s population increased from 63,396 to 68,159. And the streets? In 2005 we paved 359 miles and in 2014 we paved 422.
These numbers are terrible. We increase our population by nearly 5,000 people over ten years but we are building less? And the streets are abysmal. They need to be fixed, period.
- In 2007 we had 6.7 million square yards of streets, but by 2014 we had 7.6 million.
- Curbs have gone from 1.9 million square feet to 2.2 million square feet.
- Sidewalks have gone from 9.8 million square feet to 13.5 million.
- Signs have jumped from 54,901 in 2007 to 60,970 in 2014.
- The number of city vehicles has gone from 98 to 123.
This is waste, pure and simple, and it’s the reason property taxes are going up so much. Well, one reason among many. Folks, we do not need this stuff – we are not Beverly Hills!
Parks have gone from 46 in 2007 to 70 in 2014 and at the same time the vehicles needed for culture and recreation has jumped from 55 to 112.
I’m not sure I can go on any longer. The level of waste! I’m simply astounded at the ignorance and incompetence that has gone into this budget, and how the City Council has allowed our run-amok mayor to cheat the residents of Missoula for so long.
Yes, a day of reckoning is coming, it’s coming indeed.

